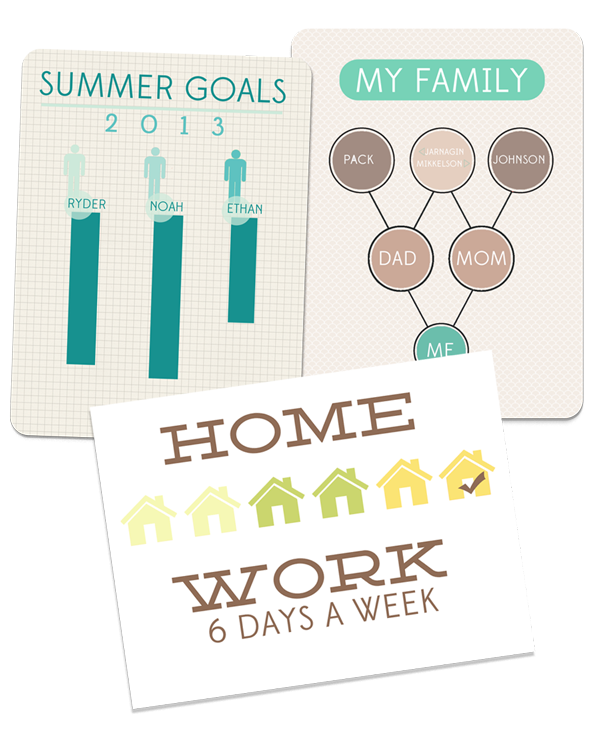
An infographic is just that; an informational graphic.
Infographics are a fun way to learn about something without all the heavy reading. For visual people (like myself), I can remember information laid out in a pie chart, but won’t remember the same information if it’s typed up in a paragraph.
It’s Data Visualization.
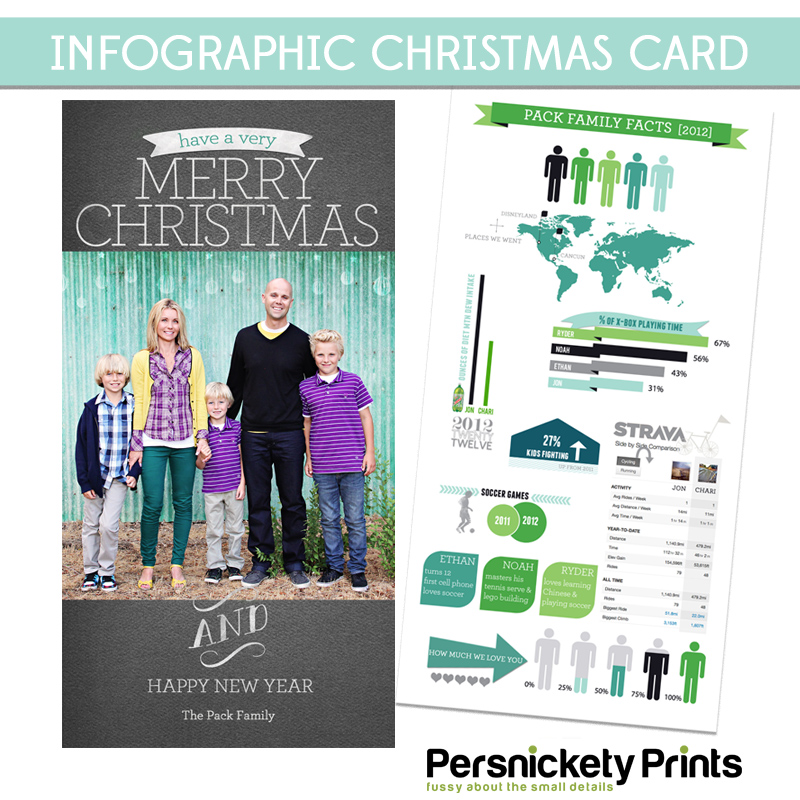
Last Christmas, instead of writing a bunch of text on a card, I created an infographic. This infographic told our family story for 2012. It wasn’t a “bragging” card full of over-the-top accomplishments making the reader feel horrible that their kids weren’t valedictorian (that’s what Facebook is for!). This infographic card was set up to share what we really did in 2012!
- Up 27% in the kids fighting category.
- Ryder had the lead in X-Box playing time.
- Thanks to Strava data we were able to compute that Jon averaged 14 miles per week on his mountain bike in 2012 and climbed over 150,000 feet.
- Jon also led the category in Mountain Dew consumption.
- To make our card even more fun, I added 5 people at the bottom scaling from 0-100% of LOVE. For each person we sent a card to, we circled how much we loved them. Most everyone received 100%. 2013 may be different.
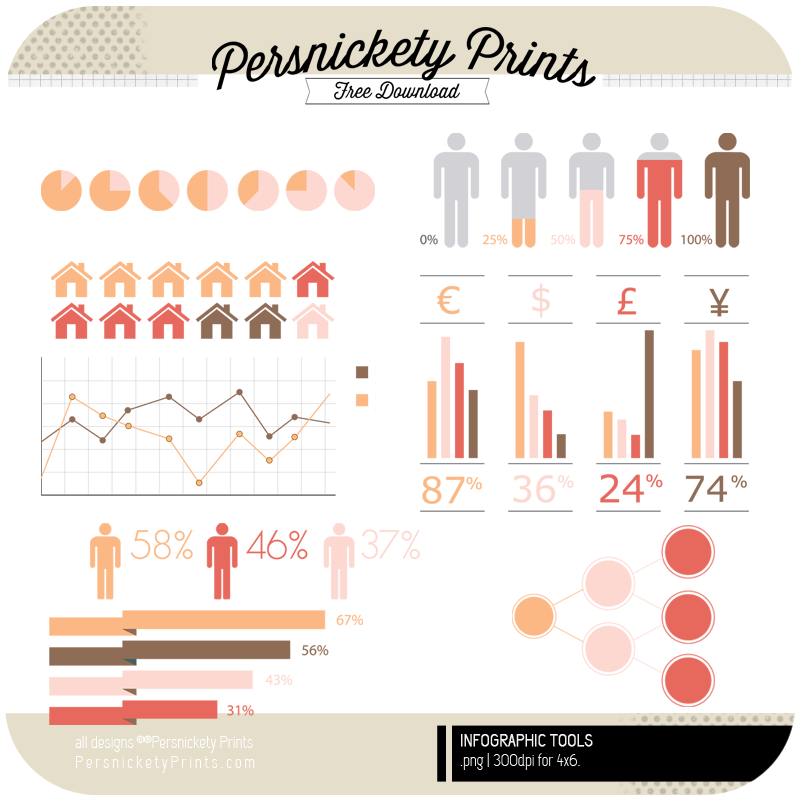
Since sending out our cards last year (a 4×8 double-sided card printed on our pearl stock), I have had a few readers asking about how they can go about making one too. I figured, what the heck; I’ll just share some graphics on the blog because what’s a great idea if I keep it all to myself!? (here you go Kacey L!)
Infographics can be used to tell YOUR story. Download these graphics to your computer (these are in .png format), recolor them, change them up, add other shapes and lines, make them your own! Create a Christmas Card, scrapbook layouts, journaling cards, family history, or use them for your business. We’re just happy to share. Enjoy.